Aim Of This Project:
The primary goal of this Prometheus Lab project is to provide hands-on experience and guidance in setting up a Prometheus monitoring system on a Kubernetes cluster. By following the step-by-step instructions and understanding the associated Kubernetes resources, participants will gain practical insights into deploying Prometheus for efficient system observability.
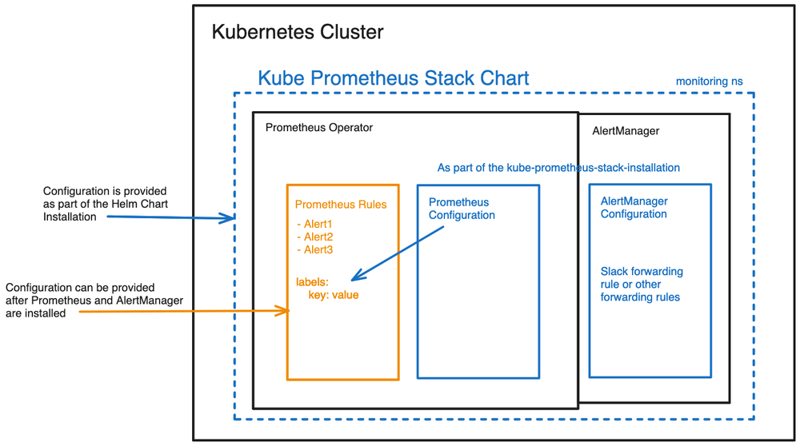
Project architecture:
Prerequisites
-
To install
k3d, you can use the following command:curl -s https://raw.githubusercontent.com/rancher/k3d/main/install.sh | bash -
Check out my GitHub Repo:
https://github.com/NotHarshhaa/Learning-Prometheus.git -
Create a Namespace for
Monitoring:kubectl create namespace monitoring -
Add Helm Repository:
helm repo add prometheus-community https://prometheus-community.github.io/helm-charts helm repo update -
Store Default values.yaml
helm show values prometheus-community/kube-prometheus-stack > values.yaml -
Install
kube-prometheus-stackHelm Chart inmonitoringNamespace:helm install prometheus-stack prometheus-community/kube-prometheus-stack -n monitoring -
Verify Deployment, after some time:
kubectl get pods -n monitoring
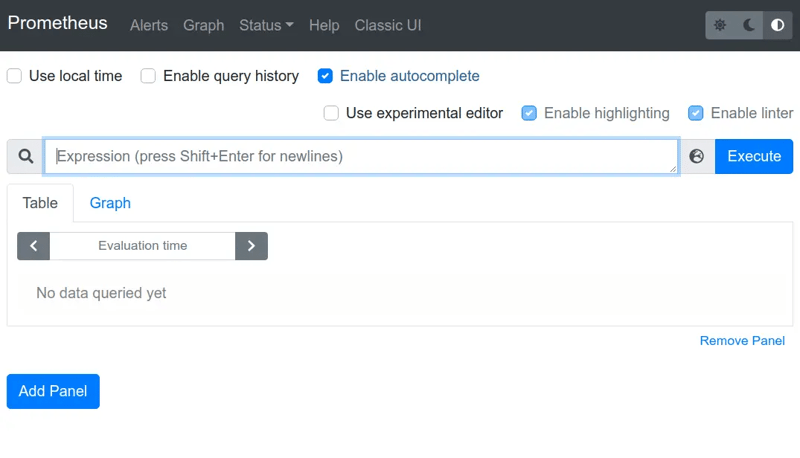
Access Prometheus Dashboard:
run the following command to access the Prometheus UI
kubectl port-forward svc/prometheus-stack-prometheus -n monitoring 9090:9090- Open your web browser and navigate to
http://localhost:9090to access the Prometheus dashboard.
Access Grafana Dashboard:
run the following command to access the Grafana UI
kubectl port-forward svc/prometheus-stack-grafana -n monitoring 8080:80- Open your web browser and navigate to
http://localhost:8080.
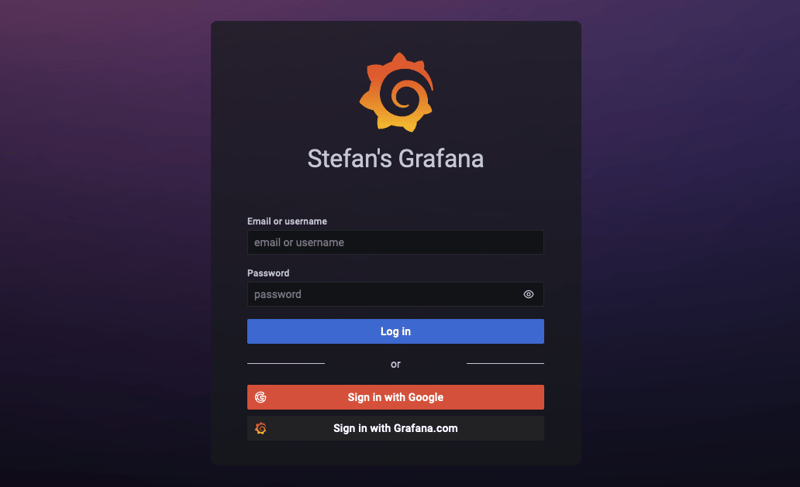
Login with the default credentials:
Username: admin. Retrieve the password using the following command:
kubectl get secret prometheus-stack-grafana -n monitoring -o jsonpath='{.data.admin-password}' | base64 --decode ; echoChange in values.yaml
In order to select AltermanagerConfig, we need to change our values.yaml file.
Search in values.yaml for alertmanagerConfigSelector
then replace that section with the following section
altermanagerConfigSelector:
  matchLabels:
  release: prometheus
Apply our k8s-yaml resources:
run the following command to deploy all resources with crds in k8s.
kubectl apply -f <your-path>/k8s-yaml/Lets Understand All Kubernetes resources:
Deployment
Let’s break down the Kubernetes Deployment YAML file in a clear and simple way:
API Version and Kind:
apiVersion: apps/v1
kind: Deployment
This part specifies the API version (apps/v1) and the type of Kubernetes resource (Deployment) we’re defining.
Metadata:
metadata:
  name: my-deployment
  labels:
    app: api
In this part, we provide metadata for our Deployment. The name is set to my-deployment, and it carries a label (app: api) for identification.
Specification (spec):
Selector:
selector:
  matchLabels:
    app: api
Here, we define a selector with labels. Pods controlled by this Deployment will have labels matching app: api.
Template:
template:
  metadata:
    labels:
      app: api
  spec:
In the template, we describe the pods created by our Deployment. Metadata labels are set, ensuring they match the selector labels.
Pod Specification (spec inside the template):
containers:
  - name: mycontainer
    image: panchanandevops/myexpress:v0.1.0
    resources:
      limits:
        memory: "128Mi"

        cpu: "500m"
    ports:
      - containerPort: 3000
Within the pod, we define a container named mycontainer. It uses the Docker image panchanandevops/myexpress:v0.1.0, has resource limits for memory and CPU, and exposes port 3000.
Service
Let’s break down the Kubernetes Service YAML file in a clear and simple way:
API Version and Kind:
apiVersion: v1
kind: Service
This section specifies the API version (v1) and the type of Kubernetes resource (Service) we’re defining.
Metadata:
metadata:
  name: my-service
  labels:
    job: node-api
    app: api
Here, we provide metadata for our Service. The name is set to my-service, and it carries labels for identifying the associated job (node-api) and application type (api).
Specification (spec):
spec:
  type: ClusterIP
  selector:
    app: api
  ports:
    - name: web
      protocol: TCP
      port: 3000
      targetPort: 3000
In this part, we define the specifications for our Service:
-
type: ClusterIP: Specifies that the Service is of type ClusterIP. -
selector: Used to match pods for this service, and in this case, it selects pods with the labelapp: api. -
ports: Defines a port namedwebwith TCP protocol, available on port3000, targeting the pods on their port3000.
ServiceMonitor
Let’s break down the Kubernetes ServiceMonitor YAML file in a clear and simple way:
API Version and Kind:
apiVersion: monitoring.coreos.com/v1
kind: ServiceMonitor
This section specifies the API version (monitoring.coreos.com/v1) and the type of Kubernetes resource (ServiceMonitor) we’re defining.
Metadata:
metadata:
  name: api-service-monitor
  labels:
    release: prometheus
    app: prometheus
Here, we provide metadata for our ServiceMonitor. The name is set to api-service-monitor, and it carries labels for release association (release: prometheus) and identifying the application type (app: prometheus).
Specification (spec):
spec:
  jobLabel: job
  selector:
    matchLabels:
      app: api
  endpoints:
    - port: web
      path: /swagger-stats/metrics
In this part, we define the specifications for our ServiceMonitor:
-
jobLabel: job: Specifies the label (job) used to identify the job for Prometheus. -
selector: Used to match pods for monitoring; it selects pods with the labelapp: api. -
endpoints: Defines the endpoints to scrape metrics. In this case, it specifies a port namedweband the path/swagger-stats/metricsto fetch metrics from.
PrometheusRules
Let’s break down the Kubernetes PrometheusRules YAML file in a clear and simple way:
API Version and Kind:
apiVersion: monitoring.coreos.com/v1
kind: PrometheusRule
This section specifies the API version (monitoring.coreos.com/v1) and the type of Kubernetes resource (PrometheusRule) we’re defining.
Metadata:
metadata:
  name: api-prometheus-rule
  labels:
    release: prometheus
Here, we provide metadata for our PrometheusRule. The name is set to api-prometheus-rule, and it carries labels for release association (release: prometheus).
Specification (spec):
spec:
  groups:
    - name: api
      rules:
        - alert: down
          expr: up == 0
          for: 0m
          labels:
            severity: Critical
          annotations:
            summary: Prometheus target missing {{$labels.instance}}
In this part, we define the specifications for our PrometheusRule:
-
groups: An array of rule groups. In this case, we have one group namedapi.-
name: api: Name of the rule group. -
rules: An array of rules within the group. -
alert: down: Name of the alert. -
expr: up == 0: Expression to trigger the alert when the metric ‘up’ is equal to 0. -
for: 0m: Minimum duration for which the alert condition must be true to trigger the alert. -
labels: Additional labels associated with the alert (e.g., severity). -
annotations: Annotations provide additional information about the alert (e.g., summary).
-
Alertmanagerconfig
Let’s break down the Kubernetes Alertmanagerconfig YAML file in a clear and simple way:
API Version and Kind:
apiVersion: monitoring.coreos.com/v1
kind: AlertmanagerConfig
This section specifies the API version (monitoring.coreos.com/v1) and the type of Kubernetes resource (AlertmanagerConfig) we’re defining.
Metadata:
metadata:
  name: alertmanager-config
  labels:
    release: prometheus
Here, we provide metadata for our AlertmanagerConfig. The name is set to alertmanager-config, and it carries labels for release association (release: prometheus).
Specification (spec):
-
Part 1: Route Configuration:
spec: route: groupBy: ["severity"] groupWait: 30s groupInterval: 5m repeatInterval: 12h receiver: "team-notifications" -
Part 2: Receiver Configuration:
spec:
  receivers:
    - name: "team-notifications"
      emailConfigs:
        - to: "team@example.com"
          sendResolved: true
-
- name: "team-notifications": Name of the receiver. -
emailConfigs:Email-specific configuration. -
- to: "team@example.com": Email address to which notifications are sent. -
sendResolved: true: Indicates whether to send notifications when alerts are resolved.